Bom dia, caros leitores do habr, no dia 12 de agosto de 2020 foram divulgadas as etapas da mudança no âmbito do programa de reforma (vocês podem conferir aqui ) e gostaria de saber como ficaria se essas etapas fossem visualizadas. Aqui é necessário esclarecer que não estou de forma alguma conectado com o governo de Moscou, mas sou o feliz proprietário de um apartamento em um prédio para reforma, então eu estava interessado em ver, talvez até mesmo com alguma estimativa precisa para onde a onda de renovação poderia se mover no meu caso (e talvez no seu, se você estiver interessado nisso, caro leitor). Claro, uma previsão precisa não funcionará, mas pelo menos será possível ver a imagem de um novo ângulo.
UPD 28 de agosto de 2020 Temos
um mapa de renovação completo com ondas de renovação e locais de lançamento marcados.
Introdução
12 2020 . № 45/182/-335/20 ( ) 2032 ( ):
- 2020 — 2024., 930 , 3-29
- 2025 — 2028., 1636 , 30-76
- 2029 — 2032., 1809 , 77-128
- ( 1 2021.) — 688 , 129-148
- , . , .
, .. — pdf , tabula pdf .
import pandas as pd
import numpy as np
import requests
from tabula import read_pdf
import json
import os
, , .
test = read_pdf('prikaz_grafikpereseleniya.pdf', pages='3', pandas_options={'header':None})test.head()| 0 | 1 | 2 | 3 | 4 | 5 | |
|---|---|---|---|---|---|---|
| 0 | No / | NaN | unom | |||
| 1 | 1 | ., .49 c.4 | NaN | 1316 | ||
| 2 | 2 | ., .77 c.3 | NaN | 1327 | ||
| 3 | 3 | ., .2/26 | NaN | 19328 | ||
| 4 | 4 | ., .3 | NaN | 31354 |
, , , parse_pdf_table.
def parse_pdf_table(pages, pdf_file='prikaz_grafikpereseleniya.pdf'):
    df = read_pdf(pdf_file, pages=pages, pandas_options={'header':None})

    #
    df = df[~(df.iloc[:,0] == 'No /')]

    #
    df = df.iloc[:,1:4]
    df.columns = ['AO', 'district', 'address']

    return df
, , .. , pdf . ( , .. )
wave_1 = parse_pdf_table('3-29') # 2020 - 2024
wave_1['wave'] = 1wave_1.shape(930, 4)wave_2 = parse_pdf_table('30-76') # 2025 - 2028
wave_2['wave'] = 2wave_2.shape(1636, 4)wave_3 = parse_pdf_table('77-128') # 2029 - 2032
wave_3['wave'] = 3wave_3.shape(1809, 4)unknown = parse_pdf_table('129-148')
unknown['wave'] = 0unknown.shape(688, 4) (pandas), df.
df = pd.concat([wave_1, wave_2, wave_3, unknown], ignore_index=True).
df['marker-color'] = df['wave'].map({1:'#0ACF00', #
2:'#1142AA', #
3:'#FFFD00', #
0:'#FD0006'}) # .
df['iconContent'] = df['wave'].map({1:'1',
2:'2',
3:'3',
0:''}).
df['description'] = df['address']— , , , , , . ( ! :)
def add_city(x):
if x['AO'] == '':
return ', ' + x['address']
return ', ' + x['address']df['address'] = df[['AO', 'address']].apply(add_city, axis=1)def geocoder(addr, key=' '):
url = 'https://geocode-maps.yandex.ru/1.x'
params = {'format':'json', 'apikey': key, 'geocode': addr}
response = requests.get(url, params=params)
try:
coordinates = response.json()["response"]["GeoObjectCollection"]["featureMember"][0]["GeoObject"]["Point"]["pos"]
lon, lat = coordinates.split(' ')
except:
lon, lat = 0, 0
return lon, lat%%time
df['longitude'], df['latitude'] = zip(*df['address'].apply(geocoder))CPU times: user 2min 11s, sys: 4.31 s, total: 2min 15s
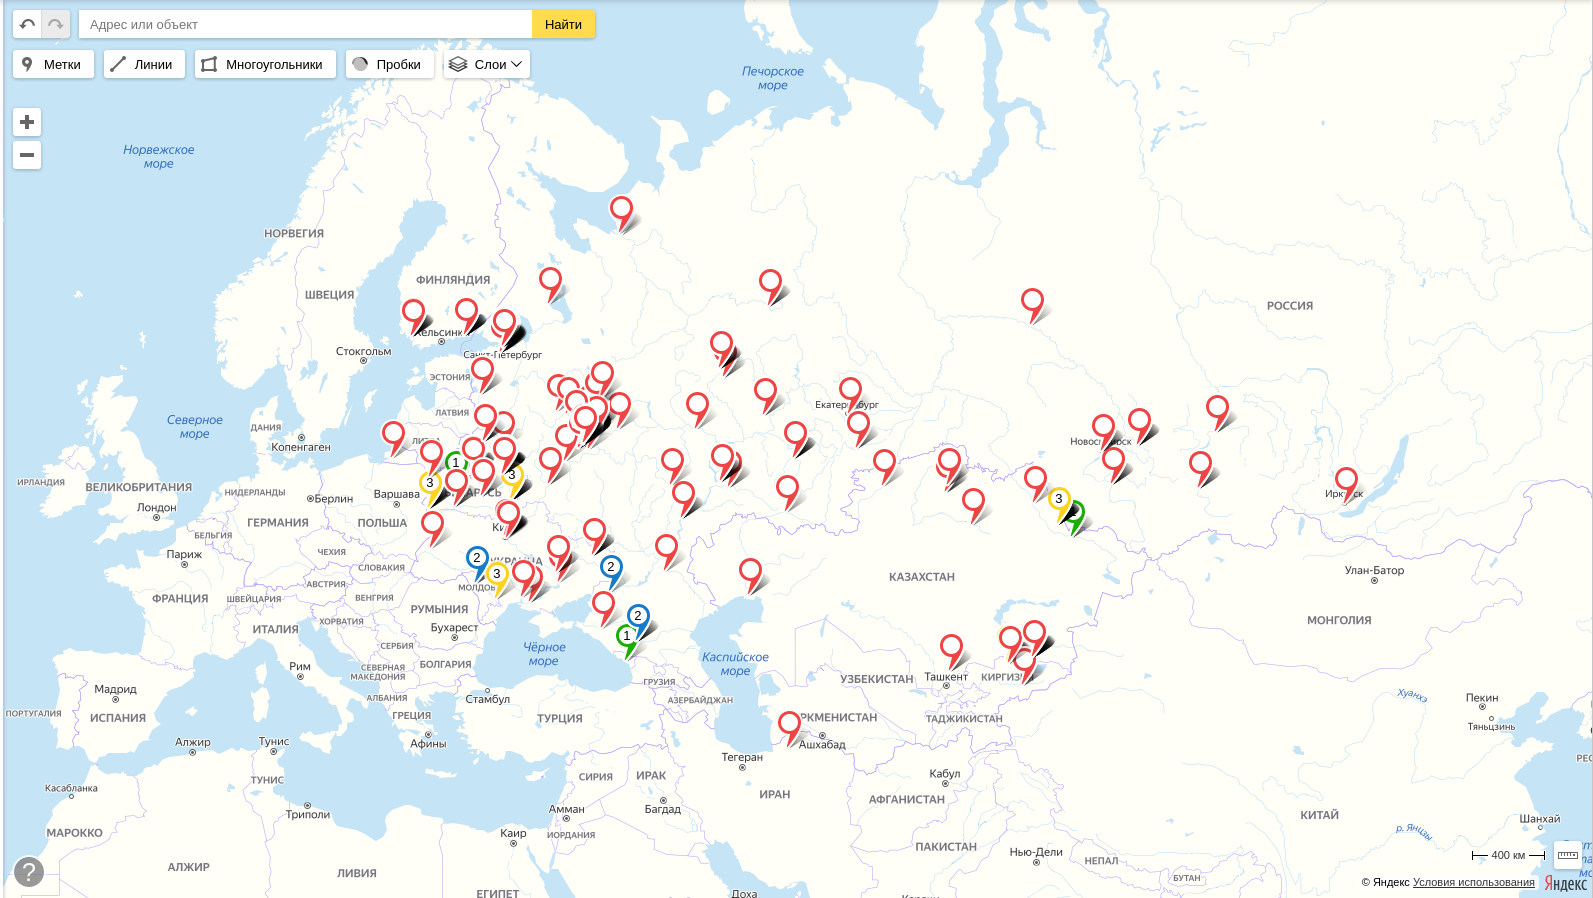
Wall time: 15min 14s( , .. , ), - - .
len(df[df['longitude'] == 0])0.
df.to_csv('waves.csv')#df = pd.read_csv('waves.csv')def df_to_geojson(df, properties, lat='latitude', lon='longitude'):
geojson = {'type':'FeatureCollection', 'features':[]}
for _, row in df.iterrows():
feature = {'type':'Feature',
'properties':{},
'geometry':{'type':'Point',
'coordinates':[]}}
feature['geometry']['coordinates'] = [row[lon],row[lat]]
for prop in properties:
feature['properties'][prop] = row[prop]
geojson['features'].append(feature)
return geojson.. , , .
properties = ['marker-color', 'iconContent', 'description']
if not os.path.exists('data'):
os.makedirs('data')
for ao, data in df.groupby('AO'):
geojson = df_to_geojson(data, properties)
with open('data/' + ao + '.geojson', 'w') as f:
json.dump(geojson, f, indent=2) .geojson data. _.geojson .
geojson = df_to_geojson(df, properties)
with open('data/_.geojson', 'w') as f:
json.dump(geojson, f, indent=2) 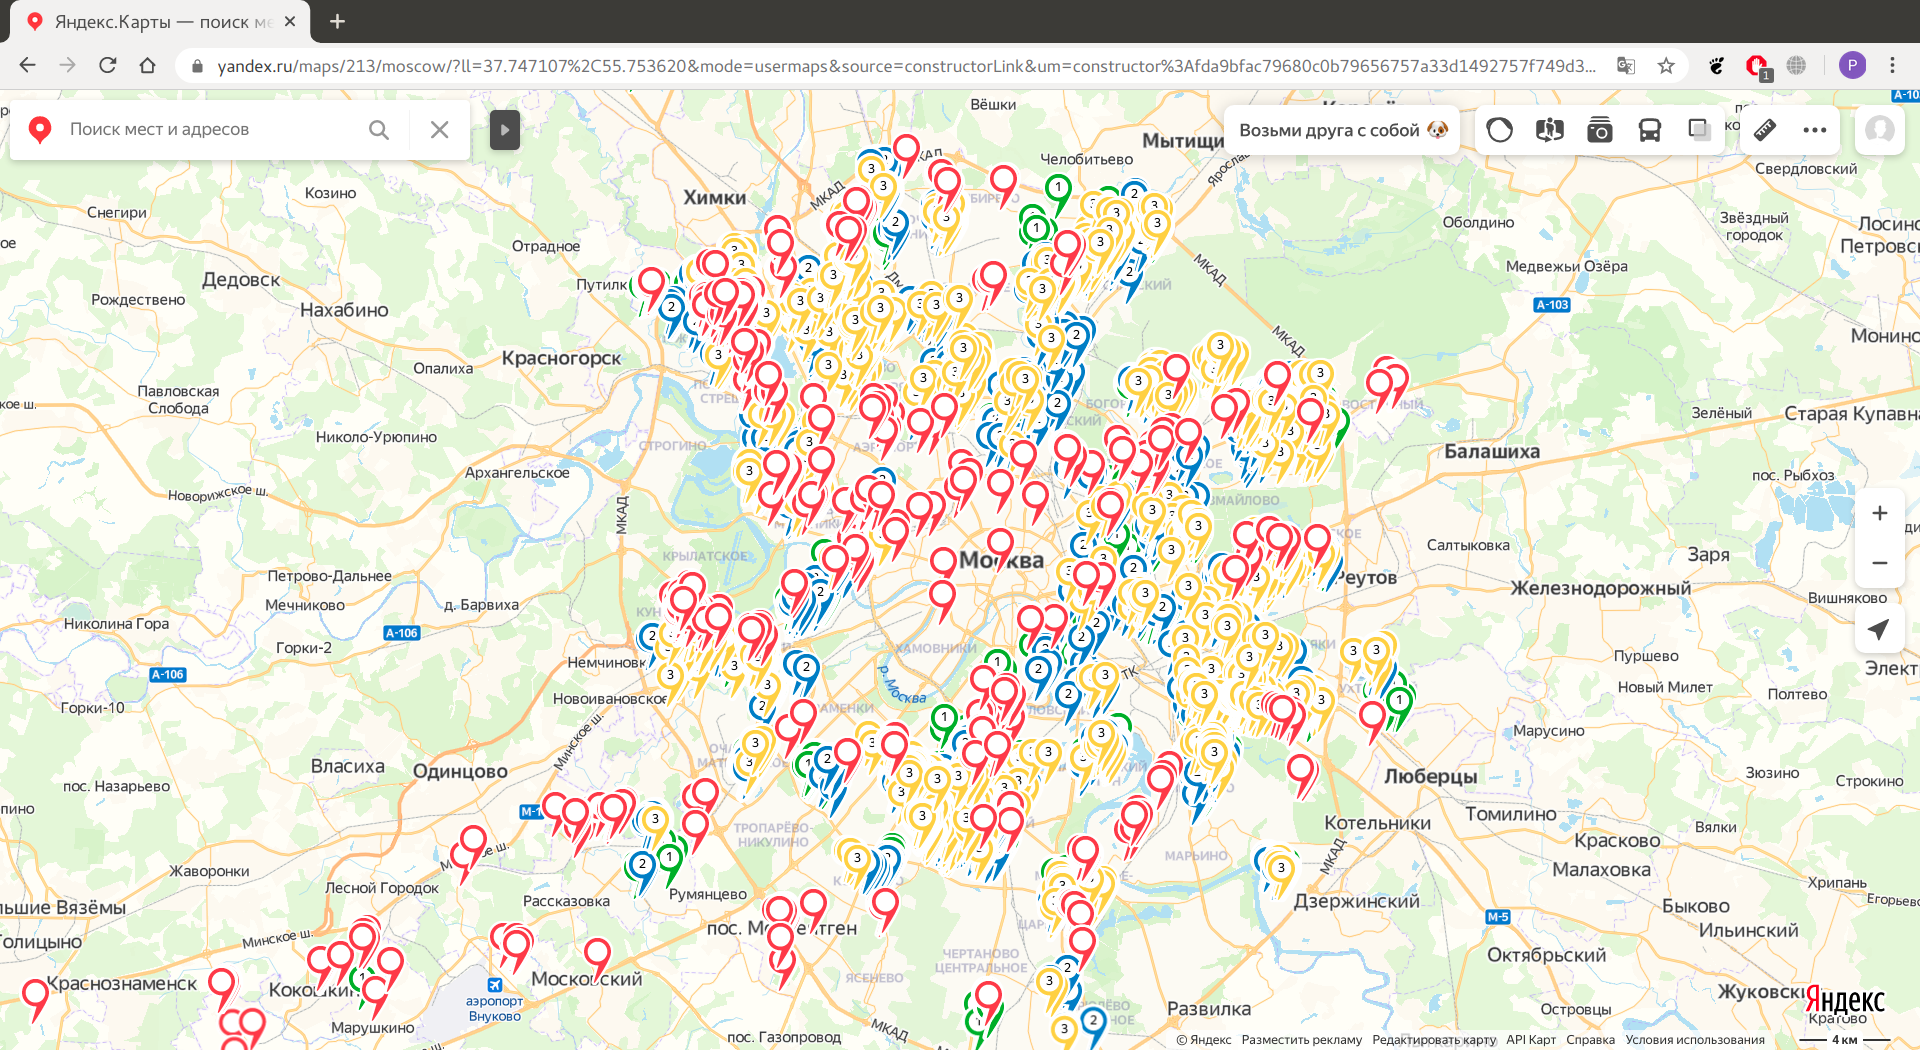

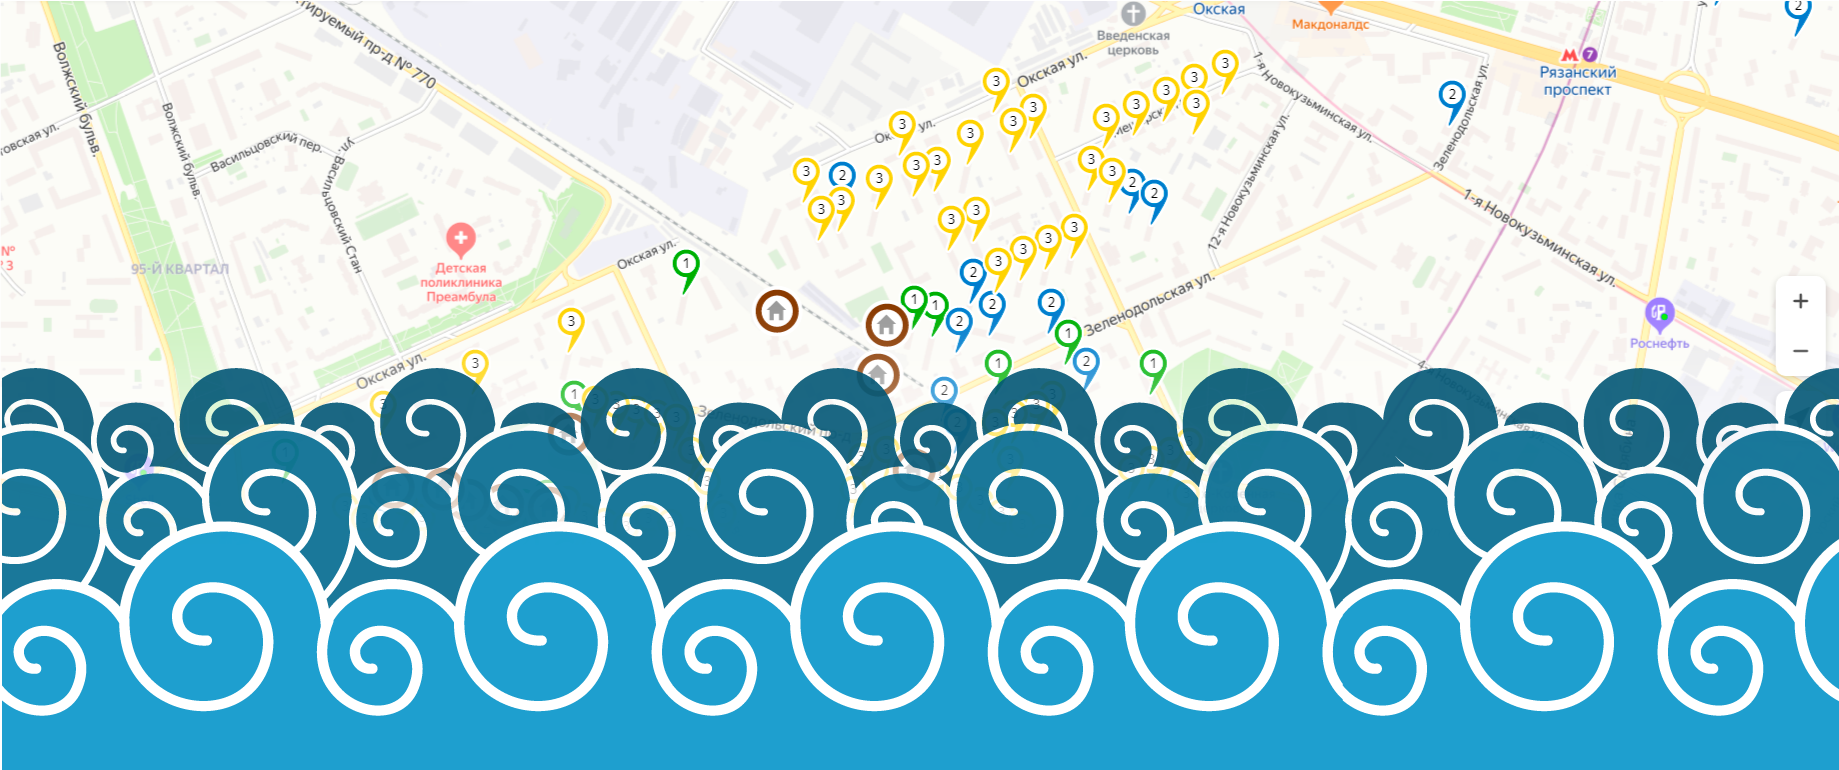
, , , , — (.), .1 - — . (. , .), .8//. ( , )
, :(
, . , , , , , , , . 39, , . 6, — , . 1, 2, 3, . 38.
— !

- , , . , PbIXTOP, .
2.0
import pandas as pd
import numpy as np
import json
from tabula import read_pdf
from tqdm.notebook import tqdm
import os
with open('renovation_address.txt') as f:
bounded_addresses = json.load(f)def parse_pdf_table(pages, pdf_file='prikaz_grafikpereseleniya.pdf'):
df = read_pdf(pdf_file, pages=pages, pandas_options={'header':None})
#
df = df[~(df.iloc[:,0] == 'No /')]
df['unom'] = df.iloc[:,-1].combine_first(df.iloc[:,-2])
#
df = df.iloc[:,[1, 2, 3, -1]]
df.columns = ['AO', 'district', 'description', 'unom']
return dfwave_1 = parse_pdf_table('3-29') # 2020 - 2024
wave_1['wave'] = 1
wave_2 = parse_pdf_table('30-76') # 2025 - 2028
wave_2['wave'] = 2
wave_3 = parse_pdf_table('77-128') # 2029 - 2032
wave_3['wave'] = 3
unknown = parse_pdf_table('129-148')
unknown['wave'] = 0df = pd.concat([wave_1, wave_2, wave_3, unknown], ignore_index=True)df['marker-color'] = df['wave'].map({1:'#0ACF00', #
2:'#1142AA', #
3:'#FFFD00', #
0:'#FD0006'}) #
df['iconContent'] = df['wave'].map({1:'1',
                                    2:'2',
                                    3:'3',
0:''})df['longitude'] = 0
df['latitude'] = 0for i in tqdm(bounded_addresses):
unom = i['unom']
coordinates = i['center']['coordinates']
df.loc[df['unom']==unom, 'longitude'] = coordinates[1]
df.loc[df['unom']==unom, 'latitude'] = coordinates[0]HBox(children=(FloatProgress(value=0.0, max=5152.0), HTML(value='')))# , ..
df.loc[(df['AO'] == '') | (df['AO'] == ''), 'AO'] = ''df[df['longitude'] == 0]| AO | district | description | unom | wave | marker-color | iconContent | longitude | latitude | |
|---|---|---|---|---|---|---|---|---|---|
| 917 | - | . (.-), .11 | 15000016 | 1 | #0ACF00 | 1 | 0.0 | 0.0 | |
| 918 | - | . (.-), .13 | 15000015 | 1 | #0ACF00 | 1 | 0.0 | 0.0 | |
| 919 | - | . (.-), .3 | 15000013 | 1 | #0ACF00 | 1 | 0.0 | 0.0 | |
| 925 | - | . (.-), .4 | 15000012 | 1 | #0ACF00 | 1 | 0.0 | 0.0 | |
| 926 | - | . (.-), .6 | 15000014 | 1 | #0ACF00 | 1 | 0.0 | 0.0 | |
| 4883 | . (. , .)... | 4405823 | 0 | #FD0006 | 0.0 | 0.0 | |||
| 4945 | . (., /), .51 | 20000002 | 0 | #FD0006 | 0.0 | 0.0 | |||
| 4946 | . (., /), .52 | 20000003 | 0 | #FD0006 | 0.0 | 0.0 | |||
| 4947 | . (., /), .53 | 20000001 | 0 | #FD0006 | 0.0 | 0.0 | |||
| 4948 | . (., /), .85 | 20000000 | 0 | #FD0006 | 0.0 | 0.0 | |||
| 4995 | (.), .1 | 20000004 | 0 | #FD0006 | 0.0 | 0.0 |
,
df.loc[917, ['longitude', 'latitude']] = 37.204805, 55.385382
df.loc[918, ['longitude', 'latitude']] = 37.205255, 55.385367
df.loc[919, ['longitude', 'latitude']] = 37.201518, 55.385265
df.loc[925, ['longitude', 'latitude']] = 37.201545, 55.384927
df.loc[926, ['longitude', 'latitude']] = 37.204151, 55.384576
df.loc[4883, ['longitude', 'latitude']] = 37.321218, 55.661308
df.loc[4945, ['longitude', 'latitude']] = 37.476896, 55.604153
df.loc[4946, ['longitude', 'latitude']] = 37.477406, 55.603895
df.loc[4947, ['longitude', 'latitude']] = 37.476546, 55.602729
df.loc[4948, ['longitude', 'latitude']] = 37.477568, 55.604659
df.loc[4995, ['longitude', 'latitude']] = 37.176806, 55.341541
with open('start_area.txt') as f:
end = json.load(f)data = {
'AO':[],
'district':[],
'longitude':[],
'latitude':[],
'description':[]
}
for i in end['response']:
data['AO'].append(i['OKRUG'])
data['district'] = i['AREA']
coordinates = i['geoData']['coordinates']
data['longitude'].append(coordinates[1])
data['latitude'].append(coordinates[0])
description = i['Address']
if 'StartOfRelocation' in i:
if i['StartOfRelocation'] is not None:
description += '\n' + i['StartOfRelocation']
data['description'].append(description)
df_start_area = pd.DataFrame(data)
df_start_area['marker-color'] = '#7D3E00' #
df_start_area['iconContent'] = '0'
df_start_area['unom'] = None
df_start_area['wave'] = -1
df = pd.concat([df, df_start_area], ignore_index=True)
def df_to_geojson(df, properties, lat='latitude', lon='longitude'):
    geojson = {'type':'FeatureCollection', 'features':[]}
    for _, row in df.iterrows():
        feature = {'type':'Feature',
                   'properties':{},
                   'geometry':{'type':'Point',
                               'coordinates':[]}}
        feature['geometry']['coordinates'] = [row[lon],row[lat]]
        for prop in properties:
            feature['properties'][prop] = row[prop]
        geojson['features'].append(feature)
return geojsonproperties = ['marker-color', 'iconContent', 'description'].
if not os.path.exists('data'):
os.makedirs('data')
for ao, data in df.groupby('AO'):
geojson = df_to_geojson(data, properties)
with open('data/' + ao + '.geojson', 'w') as f:
json.dump(geojson, f, indent=2) ( )
geojson = df_to_geojson(df, properties)

with open('data/_.geojson', 'w') as f:
json.dump(geojson, f, indent=2) , , , , , , , .
UPD 28 2020
.
PbIXTOP , .
UPD 1 2020
Adicionado código atualizado para formar o mapa, escondeu a implementação, porque a maioria dos leitores do artigo está interessada apenas no mapa.
Obrigado pela atenção.