Este artigo cobre todo o ciclo de trabalho com métricas. Primeiro, configure seu aplicativo para fornecer métricas. Configurando o Prometheus para coletar e armazenar métricas. Configurando o Grafana para exibir as métricas coletadas.
Requisitos
1. Maven , mas pode ser adaptado para outros construtores.
2. Docker e docker-compose para executar o Prometheus e o Grafana.
3. Spring boot 2 e superior, no entanto, existem portas para versões anteriores .
Introdução
Spring boot 2 Micrometer . . Prometheus .
[ spring initilizr]
spring boot .
<dependency>
<groupId>org.springframework.boot</groupId>
<artifactId>spring-boot-starter-web</artifactId>
</dependency>
actuator
Spring boot , . .
<dependency>
<groupId>org.springframework.boot</groupId>
<artifactId>spring-boot-starter-actuator</artifactId>
</dependency>
-, actutor 8080 uri /actuator
- github actuator localhost:8080/actuator
, .
{
"_links":{
"self":{
"href":"http://localhost:8080/actuator",
"templated":false
},
"health-path":{
"href":"http://localhost:8080/actuator/health/{*path}",
"templated":true
},
"health":{
"href":"http://localhost:8080/actuator/health",
"templated":false
},
"info":{
"href":"http://localhost:8080/actuator/info",
"templated":false
}
}
}
actuator .
Micrometer - spring boot, , Prometheus .
<dependency>
<groupId>io.micrometer</groupId>
<artifactId>micrometer-registry-prometheus</artifactId>
</dependency>
application.yml
Prometheus actuator.
management: endpoints: web: exposure: include: health,prometheus metrics: export: prometheus: enabled: true distribution: percentiles-histogram: "[http.server.requests]": true
health,prometheus
actuator. Prometheus, `percentiles-histogram`, sla .
, http://localhost:8080/actuator/prometheus
.
# TYPE jvm_memory_committed_bytes gauge
jvm_memory_committed_bytes{area="heap",id="G1 Survivor Space",} 9437184.0
jvm_memory_committed_bytes{area="heap",id="G1 Old Gen",} 9.961472E7
jvm_memory_committed_bytes{area="nonheap",id="Metaspace",} 4.2254336E7
jvm_memory_committed_bytes{area="nonheap",id="CodeHeap 'non-nmethods'",} 2555904.0
# TYPE jvm_gc_live_data_size_bytes gauge
jvm_gc_live_data_size_bytes 0.0
# HELP tomcat_sessions_active_max_sessions
# TYPE tomcat_sessions_active_max_sessions gauge
tomcat_sessions_active_max_sessions 0.0
# HELP jvm_threads_live_threads The current number of live threads including both daemon and non-daemon threads
# TYPE jvm_threads_live_threads gauge
jvm_threads_live_threads 27.0
, jvm -.
docker-compose.yml
Prometheus Grafana.
version: '3.7'
services:
grafana:
build: './config/grafana'
ports:
- 3000:3000
volumes:
- ./grafana:/var/lib/grafana
environment:
- GF_SECURITY_ADMIN_USER=admin
- GF_SECURITY_ADMIN_PASSWORD=admin
networks:
monitoring:
aliases:
- grafana
prometheus:
image: prom/prometheus
ports:
- 9090:9090
volumes:
- ./config/prometheus.yml:/etc/prometheus/prometheus.yml
- ./prometheus:/prometheus
networks:
monitoring:
aliases:
- prometheus
networks:
monitoring:
, Grafana , , volume.
grafana , . Dockerfile
Grafana .
FROM grafana/grafana
ADD ./provisioning /etc/grafana/provisioning
prometheus.yml
.
.
scrape_configs:
- job_name: 'sample_monitoring'
scrape_interval: 5s
metrics_path: '/actuator/prometheus'
static_configs:
- targets: ['host.docker.internal:8080']
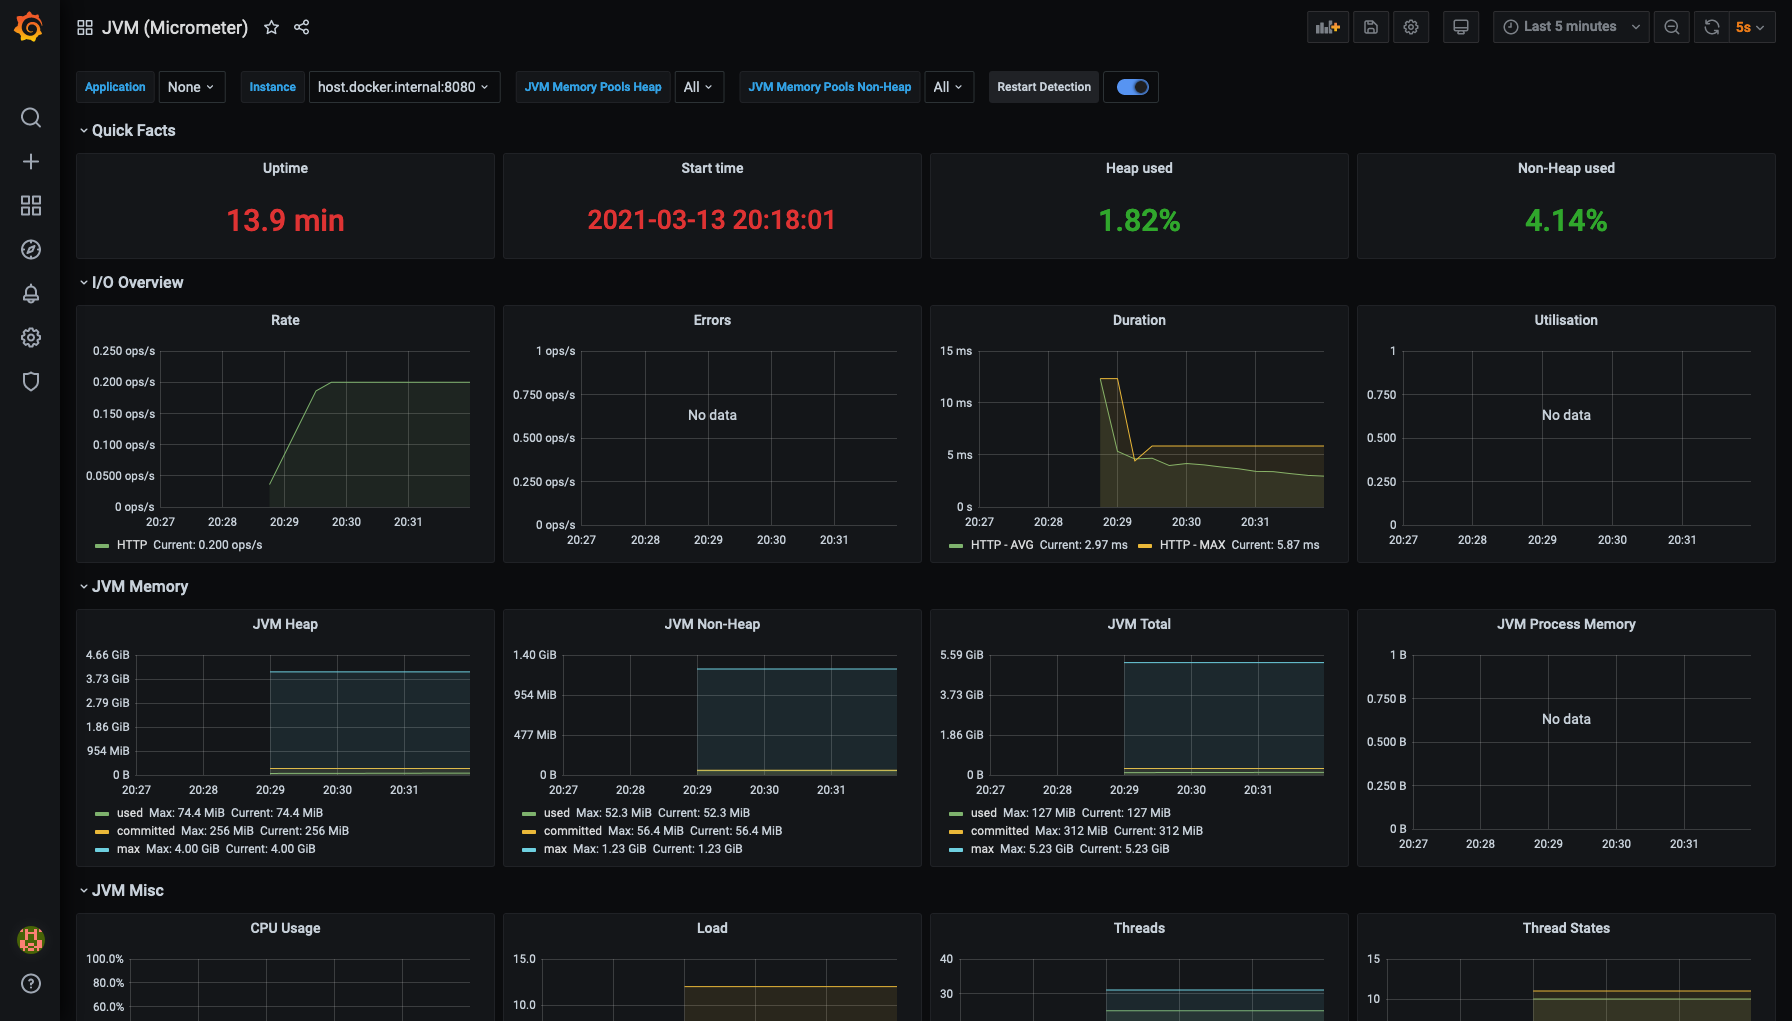
No exemplo preparado, dois painéis populares são adicionados imediatamente após o lançamento.
1. JVM

2. Taxa de transferência de resposta

Conclusão
1. Configurou um aplicativo que fornece métricas.
2. Coleta configurada de métricas usando o Prometheus.
3. Painéis configurados para visualização do resultado no Grafana.
Links
Aplicativo de exemplo no github