Olá, Habr.
Uma vez me deparei com a descrição de um aplicativo Android que determinava a frequência cardíaca pela câmera do telefone, apenas pela imagem geral. A câmera não foi aplicada ao dedo, não foi iluminada pelo LED. Um ponto interessante foi que os revisores não acreditaram na possibilidade de tal determinação de pulso, e o pedido foi rejeitado. Não sei como ficou o autor do programa, mas ficou interessante verificar se isso é possível.
Para quem está interessado no que aconteceu, a continuação sob o corte.
Claro, não vou fazer um aplicativo para Android, é muito mais fácil testar a ideia em Python.
Recebemos dados da câmera
Primeiro, precisamos obter o fluxo da webcam, para a qual usaremos o OpenCV. O código é multiplataforma e pode ser executado em Windows e Linux / OSX.
import cv2
import io
import time


cap = cv2.VideoCapture(0)
cap.set(cv2.CAP_PROP_FRAME_WIDTH, 1920)
cap.set(cv2.CAP_PROP_FRAME_HEIGHT, 1080)
cap.set(cv2.CAP_PROP_FPS, 30)

while(True):
    ret, frame = cap.read()

    # Our operations on the frame come here
    img = cv2.cvtColor(frame, cv2.COLOR_BGR2GRAY)

    # Display the frame
    cv2.imshow('Crop', crop_img)
    if cv2.waitKey(1) & 0xFF == ord('q'):
        break

cap.release()
cv2.destroyAllWindows()
, - , , .
x, y, w, h = 800, 500, 100, 100
crop_img = img[y:y + h, x:x + w]

cv2.imshow('Crop', crop_img)
, ( ) :

, , . .
heartbeat_count = 128
heartbeat_values = [0]*heartbeat_count
heartbeat_times = [time.time()]*heartbeat_count

while True:
    ...
    # Update the list
    heartbeat_values = heartbeat_values[1:] + [np.average(crop_img)]
    heartbeat_times = heartbeat_times[1:] + [time.time()]
numpy.average , , .
:
fig = plt.figure()
ax = fig.add_subplot(111)
while(True):
    ...

    ax.plot(heartbeat_times, heartbeat_values)
    fig.canvas.draw()
    plot_img_np = np.fromstring(fig.canvas.tostring_rgb(), dtype=np.uint8, sep='')
    plot_img_np = plot_img_np.reshape(fig.canvas.get_width_height()[::-1] + (3,))
    plt.cla()

    cv2.imshow('Graph', plot_img_np)
: OpenCV numpy, matplotlib , numpy.fromstring.
.
, , , " ", - . - !
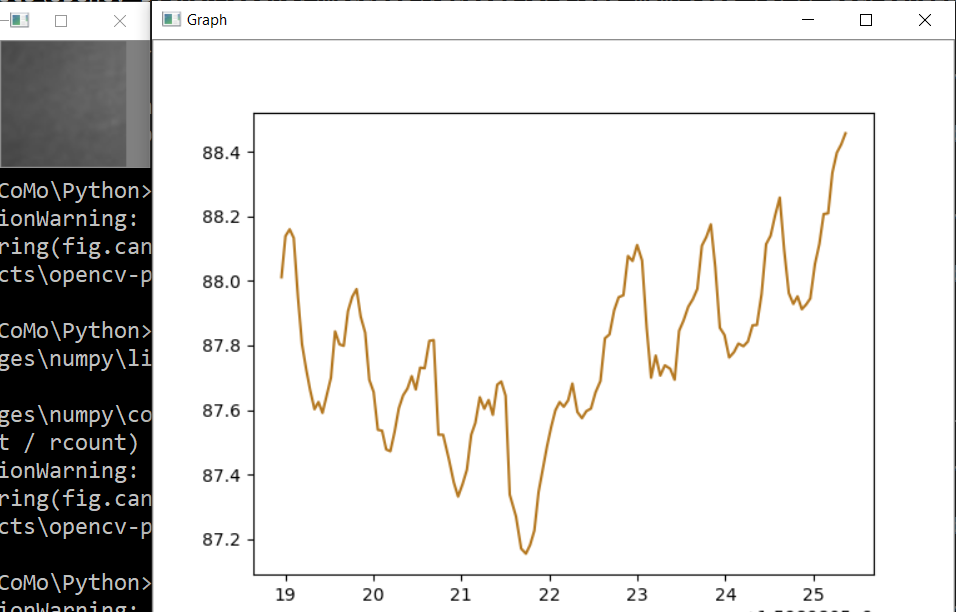
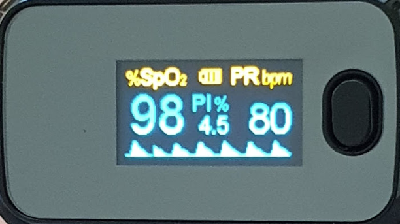
, , , . , ! , 0.5% , " ", . , , 75bpm. , :
, .. , , .
, . , . , , OpenCV . , .
, - , ? , . cap = cv2.VideoCapture(0) cap = cv2.VideoCapture("video.mp4"), .
, .
Spoiler
import numpy as np
from matplotlib import pyplot as plt
import cv2
import io
import time

# Camera stream
cap = cv2.VideoCapture(0)
cap.set(cv2.CAP_PROP_FRAME_WIDTH, 1920)
cap.set(cv2.CAP_PROP_FRAME_HEIGHT, 1280)
cap.set(cv2.CAP_PROP_FPS, 30)
# Video stream (optional)
# cap = cv2.VideoCapture("videoplayback.mp4")

# Image crop
x, y, w, h = 800, 500, 100, 100
heartbeat_count = 128
heartbeat_values = [0]*heartbeat_count
heartbeat_times = [time.time()]*heartbeat_count

# Matplotlib graph surface
fig = plt.figure()
ax = fig.add_subplot(111)

while(True):
    # Capture frame-by-frame
    ret, frame = cap.read()

    # Our operations on the frame come here
    img = cv2.cvtColor(frame, cv2.COLOR_BGR2GRAY)
    crop_img = img[y:y + h, x:x + w]

    # Update the data
    heartbeat_values = heartbeat_values[1:] + [np.average(crop_img)]
    heartbeat_times = heartbeat_times[1:] + [time.time()]

    # Draw matplotlib graph to numpy array
    ax.plot(heartbeat_times, heartbeat_values)
    fig.canvas.draw()
    plot_img_np = np.fromstring(fig.canvas.tostring_rgb(), dtype=np.uint8, sep='')
    plot_img_np = plot_img_np.reshape(fig.canvas.get_width_height()[::-1] + (3,))
    plt.cla()

    # Display the frames
    cv2.imshow('Crop', crop_img)
    cv2.imshow('Graph', plot_img_np)
    if cv2.waitKey(1) & 0xFF == ord('q'):
        break

cap.release()
cv2.destroyAllWindows()
E como de costume, todos os experimentos de sucesso